|
Conducting a snow pit study
Objective: Have students understand the nature of snow as it accumulates. This includes changes in the snow profile in temperature and crystal structure, how snow changes over time, and how snow studies benefit both climate studies and increase awareness of avalanche risk and risk management Timing: This is a 1.5 hour session and can be repeated in 40 min sessions throughout the winter. Materials: A snow study kit includes this methodology a 100 g spring scale, a clinometer, a 1mm and 2mm grid, crystal charts, meter stick, wide range thermometer, brush |
|
Approach: This is introduced in the classroom by describing all the different study aspects included in the field study (30 min). We then go directly into the field and provide a demonstration, then students try a pit of their own recording the data on the data sheet.
Evaluation: We then spend 30-40 min of class time analyzing the data then redo the field activity to”get it right”.
The background information is from the Canadian Avalanche Assn Web Site.
Snow Study Methods
Snow Pit
Dig a snow pit with the study profile facing south away from direct sunlight. The pit should be large enough for two people to work in and should have one smooth wall. All measurements will be made along this surface.
Measurements should be made in the following order:
1. Snow temperature.
2. Marking the snow horizon boundaries.
3. Average grain size and shape.
4. Snow hardness.
5. Weight of snow for calculating density.
1. Snow Temperature
Immediately after the snow pit is dug, temperature measurements should be made. This is done to minimize errors due to exposure of pit wall to air and sun. Temperatures should be taken:
a. below the litter on the soil surface.
b. above the litter just under the snow.
c. 25 cm above the soil.
d. 50 cm above the soil and every 25 cm thereafter,
e. air (shade) temperature.
In a snow profile of less than 60cm, temperature should be taken every 10 cm above the litter layer. The thermometer should be carefully inserted to its full extent into the snow. Be careful, thermometers will break very easily! Sufficient time should be allowed for the thermometer to equilibrate (approx. 3 minutes)
.
2. Marking Layer Boundaries
A profile of the snow pit should be made. Snow layer boundaries should be isolated and you should measure the thickness of each layer. Start measuring from the soil surface. Begin by delimiting those layers that are easily separable with the naked eye. Other layers may be distinguished by using your sense of touch. Run your assessment card up through the snow column. You should be able to distinguish the various layers by the differing consistency and resistance of each layer. Brush the surface of the profile. This also shows different layers. This method takes practice. Try it several times before recording data. Check yourself by doing tentative measurements of snow hardness and grain size. Make steps for each layer across the profile. These two measurements are useful for determining layer boundaries. Remember that each snowfall this winter should produce a separate layer.
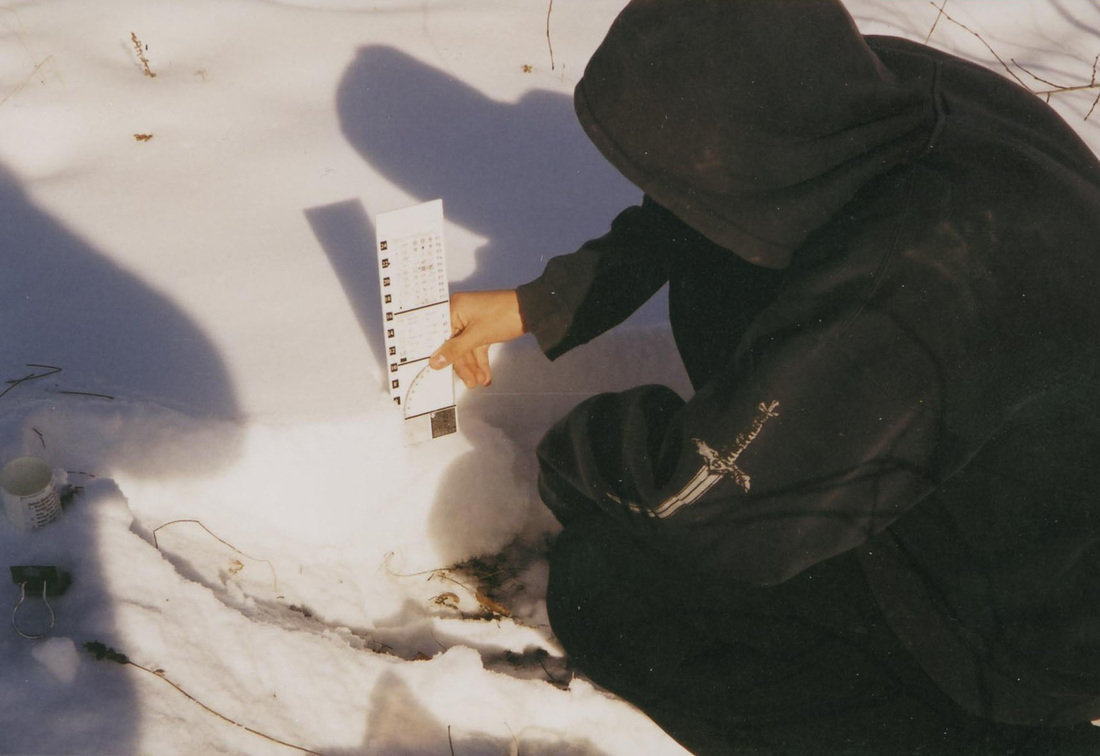
3. Average Grain Size and shape
Observations of grain size and shape should be made in each distinct layer. Grain size is taken as the maximum dimension of a single grain or crystal. In a layer formed by a fall of compound snowflakes, only the separate crystals which make up the flakes should be considered. At least 20 grains should be examined and an estimate made of their average size. For this purpose use the snow card and hand lens. The card is divided by a 1 mm grid pattern. Estimates to the nearest 0.5 mm are sufficiently accurate. When the grains are bonded together the aggregate must be broken apart before the measurements can be made, but grain fragments must not be mistaken for individual grains. In the case of extreme bonding (e.g. ice layer) or in very wet snow, grain size and shape lose their meaning and need not be recorded.
Grain shape should be determined using the 5x or 10x loup. The different grain shapes are described on the snow card. Record the appropriate letter on the data sheet.
Type ‘a’ crystals
Type ‘a’ refers to freshly deposited snow composed mainly of whole crystals or parts of broken ones. Snow which has its crystalline character while falling to earth, ice pellets, and hail do not belong in this
class (all are Type 'b' crystals). Type 'a' snow is usually very soft.
Type ‘b’ crystals
This type of snow refers to snow during the initial stage of settling. It is composed mainly of fragments of crystals but has not yet reached the stage of very fine fragments that is the end of the process of settling. Although is has lost a great deal of its crystalline character, some crystalline features can be observed; it still sparkles. Type 'b' snow is usually fairly soft.
Type ‘c’ crystals
When snow is transformed by melting or melting followed by freezing, it completely looses all crystalline features and its grains become irregular or more or less rounded. This is type 'c' snow. It has no sparkle effect even in bright sunlight and can readily recognized by its dull appearance. It is usually fairly soft when wet, but can be very hard when frozen. Type 'c' snow grains may be any size from very fine to very coarse.
Type ‘d’ crystals
At temperatures well below freezing and without any apparent melting, snow is transformed into Type 'd' by deposition of water vapor removed from crystals deeper in the profile by the process of sublimation. Deposition of this vapor higher in the profile produces irregular grains with flat facets. These layered facets are visible with a lens and give the snow a distinct sparkle effect in the bright sunlight. Type 'd' snow is usually fairly hard.
Depth Hoar
Depth hoar is characterized by its hollow cup-shaped crystals. These crystals are produced by a very low
rate of deposition of sublimed vapor during a long uninterrupted cold period. Depth hoar is most frequently found directly below a more or less impermeable crust in the lower part of the snow cover. The tensile strength of a layer of depth hoar is very low and the structure of the layer falls away at the slightest touch.
4. Snow Hardness
Snow hardness readings should be taken in the center of each distinct snow layer including ice layers. Since we do not have a hardness gauge we will estimate hardness using the measurement technique (Hand Test) detailed on the snow card. Use the following scale to determine the hardness of the snow in g/cm2.
Fist – 10 g/cm2
Four fingers – 25 g/cm2
One finger – 100 g/cm2
Pencil – 500 g/cm2
Knife – 1000 g/cm2
If a hardness gauge was available, the following technique should be used. The hardness gauge is used horizontally against the wall of the snow pit. Care should be taken in cutting the face on which the test is to be made so as to obtain a flat surface and to avoid disturbing the snow. The discs to be used have areas of 0. I cm2, I cm2, and 10 cm2. The 0.1 and 1 cm2 are part of the shaft of the gauge; while the 10 cm2 disc must be added to the end of the gauge. Use the largest disc possible. The reading is obtained by slowly pressing the disc squarely against the snow and noting the value on the scale at which the disc begins to enter the snow. While the manner in which the disc enters the snow varies somewhat with snow conditions it is usually very sudden. Very slight compression of the snow should be disregarded. Readings to the nearest half division are sufficiently accurate. Record the numerical reading, the disc size (0. 1, 1.0, or 10).
Calculations of hardness as g/cm2 pressure to penetrate the surface of the snow layer should be done after leaving the field. Calculations are made as follows: Hardness (g/cm2) = (numerical reading) x (multiplication factor for the disc used); where the numerical reading is taken directly from the gauge and the multiplication factor is determined from the following table:
Area of disc (cm2)
5. Density
Measurements of weight should be made in each layer large enough to accommodate the corer, which is a 200 cc cylinder. The density of thin hard crusts need not be measured provided their hardness has been measured.
The measurements are made by weighing a known volume of snow (200cc). Cut a core by pushing and rotating the snow corer into the layer. There must be no voids in the core. To avoid loss of part of the core on removal from the snow layer, use a spatula to cut the snow along the cutting edge of the corer while it is still in the snow layer. Remove the core (and core) and trim the ends so that the core is flush with the corer. Weigh the 200 cc core while contained in the cylinder with the spring scale, subtract the cylinder weight. Calculate snow density by dividing weight of core (g) by the corer volume (200 cm2).
Orientation to Sun Radiation from the Sun influences snow temperature which, in turn, plays a role in determining the strength of the snow. (Snow at the melting point is usually weaker than colder snow.) Sun exposed slopes tend to have higher temperatures than shaded slopes.
In the northern hemisphere shady, cold slopes facing north and east tend to have weaker snow between December and March, because surface hoar and faceted grains (which often form weaker layers in the snowpack) are more likely to form and linger there than on sunny slopes. (Surface hoar, facets, and other snow crystals and grains are discussed more fully under "Metamorphism of Snow" and "Classification of Snow Crystals and Grains".) In the late winter and spring, however, sunny, south-facing slopes are more likely to contain weak snow due to strong warming. Orientation to Wind - Loading & Lee Slopes The wind exposure of slopes is a primary factor in avalanche formation.
Lee (downwind) slopes are more likely to produce avalanches than are other slopes with equal incline because they receive much greater accumulations of dense, slabby snow. Lee slopes are found behind high ridges, fall line ribs, rows of trees, hills, convex parts of slopes, and gully walls.
Snow on slopes exposed to the wind (windward) is often shallow and/or irregular due to scouring, creating a potential weak snowpack.
While local wind is significant, it is important to remember that ridge-top wind speed and direction may be quite different from winds experienced locally.
Evaluation: We then spend 30-40 min of class time analyzing the data then redo the field activity to”get it right”.
The background information is from the Canadian Avalanche Assn Web Site.
Snow Study Methods
Snow Pit
Dig a snow pit with the study profile facing south away from direct sunlight. The pit should be large enough for two people to work in and should have one smooth wall. All measurements will be made along this surface.
Measurements should be made in the following order:
1. Snow temperature.
2. Marking the snow horizon boundaries.
3. Average grain size and shape.
4. Snow hardness.
5. Weight of snow for calculating density.
1. Snow Temperature
Immediately after the snow pit is dug, temperature measurements should be made. This is done to minimize errors due to exposure of pit wall to air and sun. Temperatures should be taken:
a. below the litter on the soil surface.
b. above the litter just under the snow.
c. 25 cm above the soil.
d. 50 cm above the soil and every 25 cm thereafter,
e. air (shade) temperature.
In a snow profile of less than 60cm, temperature should be taken every 10 cm above the litter layer. The thermometer should be carefully inserted to its full extent into the snow. Be careful, thermometers will break very easily! Sufficient time should be allowed for the thermometer to equilibrate (approx. 3 minutes)
.
2. Marking Layer Boundaries
A profile of the snow pit should be made. Snow layer boundaries should be isolated and you should measure the thickness of each layer. Start measuring from the soil surface. Begin by delimiting those layers that are easily separable with the naked eye. Other layers may be distinguished by using your sense of touch. Run your assessment card up through the snow column. You should be able to distinguish the various layers by the differing consistency and resistance of each layer. Brush the surface of the profile. This also shows different layers. This method takes practice. Try it several times before recording data. Check yourself by doing tentative measurements of snow hardness and grain size. Make steps for each layer across the profile. These two measurements are useful for determining layer boundaries. Remember that each snowfall this winter should produce a separate layer.
3. Average Grain Size and shape
Observations of grain size and shape should be made in each distinct layer. Grain size is taken as the maximum dimension of a single grain or crystal. In a layer formed by a fall of compound snowflakes, only the separate crystals which make up the flakes should be considered. At least 20 grains should be examined and an estimate made of their average size. For this purpose use the snow card and hand lens. The card is divided by a 1 mm grid pattern. Estimates to the nearest 0.5 mm are sufficiently accurate. When the grains are bonded together the aggregate must be broken apart before the measurements can be made, but grain fragments must not be mistaken for individual grains. In the case of extreme bonding (e.g. ice layer) or in very wet snow, grain size and shape lose their meaning and need not be recorded.
Grain shape should be determined using the 5x or 10x loup. The different grain shapes are described on the snow card. Record the appropriate letter on the data sheet.
Type ‘a’ crystals
Type ‘a’ refers to freshly deposited snow composed mainly of whole crystals or parts of broken ones. Snow which has its crystalline character while falling to earth, ice pellets, and hail do not belong in this
class (all are Type 'b' crystals). Type 'a' snow is usually very soft.
Type ‘b’ crystals
This type of snow refers to snow during the initial stage of settling. It is composed mainly of fragments of crystals but has not yet reached the stage of very fine fragments that is the end of the process of settling. Although is has lost a great deal of its crystalline character, some crystalline features can be observed; it still sparkles. Type 'b' snow is usually fairly soft.
Type ‘c’ crystals
When snow is transformed by melting or melting followed by freezing, it completely looses all crystalline features and its grains become irregular or more or less rounded. This is type 'c' snow. It has no sparkle effect even in bright sunlight and can readily recognized by its dull appearance. It is usually fairly soft when wet, but can be very hard when frozen. Type 'c' snow grains may be any size from very fine to very coarse.
Type ‘d’ crystals
At temperatures well below freezing and without any apparent melting, snow is transformed into Type 'd' by deposition of water vapor removed from crystals deeper in the profile by the process of sublimation. Deposition of this vapor higher in the profile produces irregular grains with flat facets. These layered facets are visible with a lens and give the snow a distinct sparkle effect in the bright sunlight. Type 'd' snow is usually fairly hard.
Depth Hoar
Depth hoar is characterized by its hollow cup-shaped crystals. These crystals are produced by a very low
rate of deposition of sublimed vapor during a long uninterrupted cold period. Depth hoar is most frequently found directly below a more or less impermeable crust in the lower part of the snow cover. The tensile strength of a layer of depth hoar is very low and the structure of the layer falls away at the slightest touch.
4. Snow Hardness
Snow hardness readings should be taken in the center of each distinct snow layer including ice layers. Since we do not have a hardness gauge we will estimate hardness using the measurement technique (Hand Test) detailed on the snow card. Use the following scale to determine the hardness of the snow in g/cm2.
Fist – 10 g/cm2
Four fingers – 25 g/cm2
One finger – 100 g/cm2
Pencil – 500 g/cm2
Knife – 1000 g/cm2
If a hardness gauge was available, the following technique should be used. The hardness gauge is used horizontally against the wall of the snow pit. Care should be taken in cutting the face on which the test is to be made so as to obtain a flat surface and to avoid disturbing the snow. The discs to be used have areas of 0. I cm2, I cm2, and 10 cm2. The 0.1 and 1 cm2 are part of the shaft of the gauge; while the 10 cm2 disc must be added to the end of the gauge. Use the largest disc possible. The reading is obtained by slowly pressing the disc squarely against the snow and noting the value on the scale at which the disc begins to enter the snow. While the manner in which the disc enters the snow varies somewhat with snow conditions it is usually very sudden. Very slight compression of the snow should be disregarded. Readings to the nearest half division are sufficiently accurate. Record the numerical reading, the disc size (0. 1, 1.0, or 10).
Calculations of hardness as g/cm2 pressure to penetrate the surface of the snow layer should be done after leaving the field. Calculations are made as follows: Hardness (g/cm2) = (numerical reading) x (multiplication factor for the disc used); where the numerical reading is taken directly from the gauge and the multiplication factor is determined from the following table:
Area of disc (cm2)
5. Density
Measurements of weight should be made in each layer large enough to accommodate the corer, which is a 200 cc cylinder. The density of thin hard crusts need not be measured provided their hardness has been measured.
The measurements are made by weighing a known volume of snow (200cc). Cut a core by pushing and rotating the snow corer into the layer. There must be no voids in the core. To avoid loss of part of the core on removal from the snow layer, use a spatula to cut the snow along the cutting edge of the corer while it is still in the snow layer. Remove the core (and core) and trim the ends so that the core is flush with the corer. Weigh the 200 cc core while contained in the cylinder with the spring scale, subtract the cylinder weight. Calculate snow density by dividing weight of core (g) by the corer volume (200 cm2).
Orientation to Sun Radiation from the Sun influences snow temperature which, in turn, plays a role in determining the strength of the snow. (Snow at the melting point is usually weaker than colder snow.) Sun exposed slopes tend to have higher temperatures than shaded slopes.
In the northern hemisphere shady, cold slopes facing north and east tend to have weaker snow between December and March, because surface hoar and faceted grains (which often form weaker layers in the snowpack) are more likely to form and linger there than on sunny slopes. (Surface hoar, facets, and other snow crystals and grains are discussed more fully under "Metamorphism of Snow" and "Classification of Snow Crystals and Grains".) In the late winter and spring, however, sunny, south-facing slopes are more likely to contain weak snow due to strong warming. Orientation to Wind - Loading & Lee Slopes The wind exposure of slopes is a primary factor in avalanche formation.
Lee (downwind) slopes are more likely to produce avalanches than are other slopes with equal incline because they receive much greater accumulations of dense, slabby snow. Lee slopes are found behind high ridges, fall line ribs, rows of trees, hills, convex parts of slopes, and gully walls.
Snow on slopes exposed to the wind (windward) is often shallow and/or irregular due to scouring, creating a potential weak snowpack.
While local wind is significant, it is important to remember that ridge-top wind speed and direction may be quite different from winds experienced locally.
