|
Snow profile measurements: stability
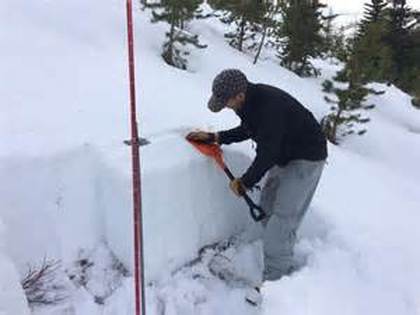
ES Classes are ofter involved in winter outdoor activities in mountainous regions. We have been studying snow stability topics since 1994 with a view that informed students will encourage an awareness of avalanche risks and avoid high risk terrain. As part of this process we developed snow pit charts that identified potential avalanche by identifying weak layers within the snow profile. We have also encouraged students to take Avalanche training courses. |
|
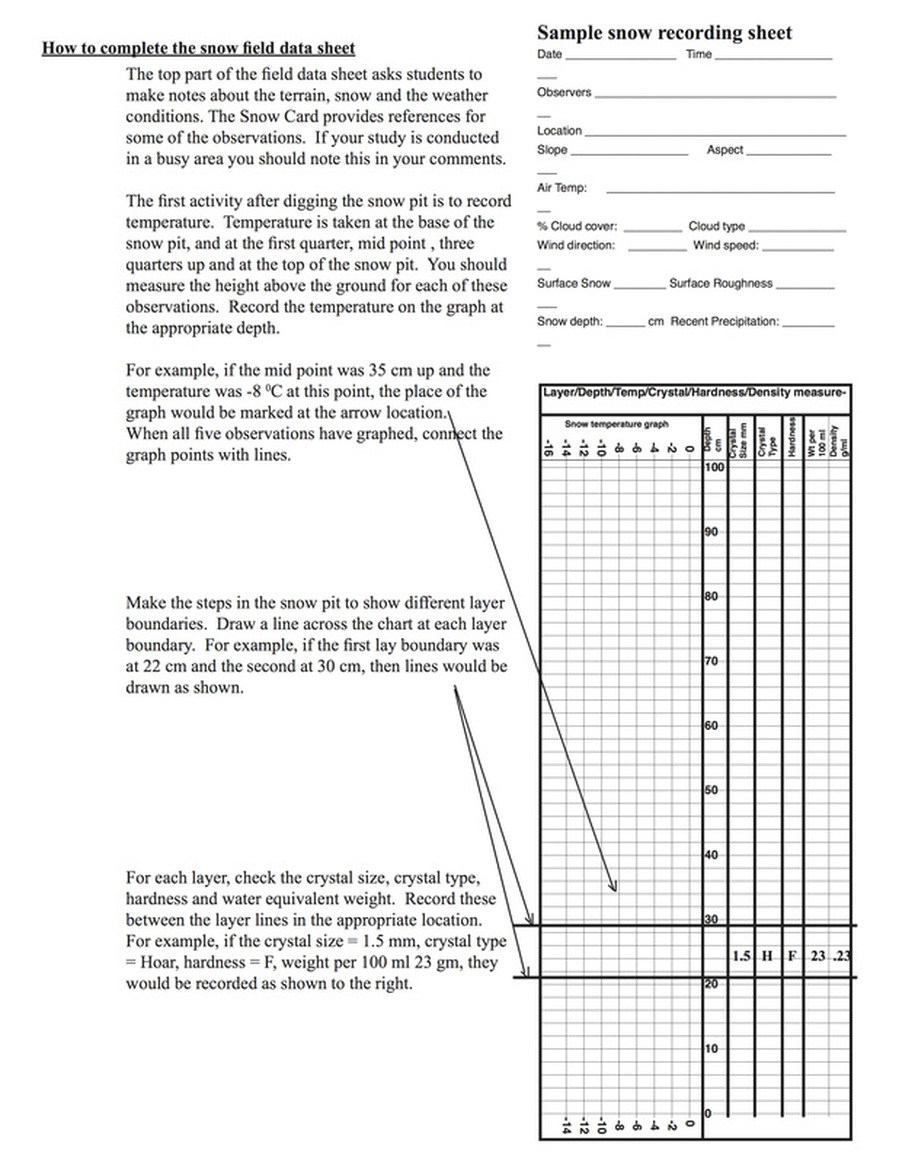
Snow Hardness: The stability of a snow pack may be influenced by the hardness of a layer in the snow pack. A soft layer of snow under a number of harder layers may make the entire layer unstable. Snow hardness readings should be taken in the centre of each snow layer including ice layers. We estimate hardness of the layer using the Hand Test technique. The Hand Test method uses a 100 gram pressure (a gentle pressure) against the face of the layer. If the fist, four fingers etc. go into the layer, then the layer is categorized as that type of hardness. If the layer is very soft, then it is quite unstable. Use the following scale to determine the hardness of the snow in g/cm2. Record the type of hardness on the data table.
Class Pressure Symbol
Fist 10 g/cm2 F
Four fingers 25 g/cm2 4F
One finger 100 g/cm2 1F
Pencil 500 g/cm2 P
Sharp Point 1000 g/cm2 K
The following resources address avalanche risks in the Mountain passes in the southern Yukon and Northern BC.
“TOP TEN SITES”
1. CAC Regional Discussion Board for the Klondike Region (Mountain Passes in southern Yukon and northern BC)
http://avalanche.ca/Forums/forums/29.aspx
2. Environment Canada Whitehorse text forecast
http://weatheroffice.ec.gc.ca/city/pages/yk-16_metric_e.html
Comments: This site is minimally useful in making a go/no-go decision on whether to head to the pass, however it does provide some "big picture" info which you may incorporate into your deliberations.
3. Fraser remote weather station ***
http://highways.polarcom.com/weather/fraser/Fraser.htm
Very helpful information. Site provides current weather conditions and a previous three day history for wind speed, wind direction and temperature. Unfortunately it does not report precipitation or snowpack information
4. Skagway Current Wx Conditions
http://weather.noaa.gov/weather/current/PAGY.html
Comments: this site contains very helpful information. The web page is divided into several "sections". The "conditions sections" at the start of the page includes wind direction and speed in Skagway both of which are often very relevant to conditions at the summit. You can also get some idea of the temperature at the summit by extrapolating from the Skagway temperature if the summit wx site on the border is down. Generally as you go higher it gets cooler (unless there is an inversion) - the rate of change is sometimes referred to as the "environmental lapse rate of temperature". As a rough rule of thumb expect it to be 2c to 3c degrees cooler per thousand feet of elevation gained. (Approx. .6 to 1.0c degree per 100 meters depending on how moist the air is: moister air .6, dryer air 1.0c). So -7c in Skagway is often a very cold day skiing on Cleveland (4500' to 6000').
The eighth line in the conditions sections is an item called "ob" (short for observation) The information in this section is in METAR code (Meteorological Aviation Report). Most of the information in the "ob line" is simply a repeat in coded form of the long-hand text. However, the "ob line" provides sky condition information including the extent of cloud cover (broken, overcast, etc) and the cloud elevation levels (for example, “broken sky at 8500' and overcast at 10000'”). This is excellent information in assessing whether Cleveland/Feather are flat light, whiteout etc.
If you are not familiar with METAR code you can easily download a METAR key on the web and the basics are quite straight forward to start working with the Skagway METAR obs. Here is one link for a METAR key to Surface Wx Observations:
http://www.ncdc.noaa.gov/oa/climate/conversion/swometardecoder.html
The Skagway Wx conditions site also provides a recent (24hr) history of max and min temps; precipitation accumulation and most interestingly (and helpful) a 24 hr summary showing wind direction and speed. If you check it daily and between weekends you get a feel for whether last week's powder has been hammered into a hard pan crust. This wind history can also help you plan what aspect you may want to ski or avoid.
5. NOAA Text forecast for Skagway and White Pass
http://www.arh.noaa.gov/zonefcst.php?zone=018
Comments: click on the Haines Skagway area of the map and it will take you to the Taiya Inlet - Skagway text forecast. See South Klondike Highway Skagway - White Pass. The forecast often includes comments on freezing levels and forecast snow accumulation at the Summit. Take the forecast snow accumulation amounts with a grain of salt…
6. MM5 Precipitation forecast which includes Yukon/Alaska
http://www.atmos.washington.edu/~ovens/loops/wxloop.cgi?mm5d1_pcp3+///3
Comments: The forecast is presented in a multi-frame coloured graphic format. You can control the speed of the loop with the buttons in the top left corner of the page. Alternately, stop the loop and use the single step buttons to proceed through the individual images. The forecast is given in three hour intervals and the date and time can be displayed in PST. The model shows sea level pressures, but most importantly provides forecast precipitation amounts via colour coding. The legend to the colour code is at the bottom of the page and gives precip amounts in 1/100ths of an inch of water. To extrapolate precip water amounts to snowfall amounts use this rule of thumb for rough estimates: 4/100th inch equals 1mm and 1mm precip water equals approx 1 cm of snowfall.
7. Fraser Wx cam (Canada Customs)
http://www.weatheroffice.pyr.ec.gc.ca/RVAS/default_e.html?section=FRASER
Comments: Excellent views towards the summit and back to Log cabin. This combined with the Fraser automated wx station http://highways.polarcom.com/weather/fraser/Fraser.htm is excellent info but lacks again snowfall/precip accumulations. (Although snowcover on the road can give you an idea of recent snowfall activity.)
8. Alaska Wx Cams including Haines
http://akweathercams.faa.gov/sitelist.php
Comments: click on the Haines Skagway Juneau area part of the map, follow the link to the Haines camera. You get three images North, Southeast and West. The view to the north looks up the Taiya Inlet and can provide a good idea of the cloud cover and ceiling levels near the summit. When the NOAA text forecast is calling for south winds and clearing wx you can often see the improving wx on the southeast camera image.
9 & 10. Alaska Road Weather Information System (RWIS)
- Klondike Highway /US Canada border remote wx station (2 websites report information from this station)
http://www.met.utah.edu/cgi-bin/droman/meso_base.cgi?stn=KLNA2&time=GMT
This station is close to the departure point for Feather and Cleveland. When the station is operating the information is quite helpful – particularly for wind direction, wind speed and temperature. However the station is often down. The last site listed above will also display weather information for previous periods.
ADDITIONAL INFORMATION
Learning about weather - The CAA has a good weather section with a tutorial as does Environment Canada and many other sites.
http://www.avalanche.ca/CAC_Weather_Images
http://www.avalanche.ca/CAC_Weather_ImageTutorial
http://www.weatheroffice.gc.ca/canada_e.html
Basic weather map
http://weatheroffice.ec.gc.ca/jet_stream/index_e.html
Alaska Wx links
http://www.dot.state.ak.us/iways/roadweather/forms/AKWeatherLinks.html
Alaska Road Weather Information System (RWIS)
- Haines Hwy @ Klehini MP 36.
- Haines Highway @ Chilkat River Bridge MP 23.8
Kind of far from the pass but one of the cameras lets you see cloud ceiling.
Note: Zulu time is 8hrs later than local time…and forecasts are often good (they will usually tell you) for the 12 hr period previous to the valid time…so a map valid 0Z Wed is good for 4AM to 4PM Tue. Note that wx cam times are always given in Zulu.
850 mb chart showing weather conditions at the 850 mb level or around 5000 feet above sea level.
This 850 mb chart shows weather conditions at the 850 mb level or around 5000 feet above sea level. The parameters plotted are temperatures in Celsius (in color contours), heights in white lines and winds plotted as vectors. Forecasts good for the 12 hr period previous to the valid time. The loop feature may be problematic on a dial up connection…
http://weather.unisys.com/gfsx/9panel/gfsx_850_9panel.html
Short & Medium Range GFS Forecasts for North America
Short
http://wxmaps.org/pix/avnsr.fcst.html
Medium
http://wxmaps.org/pix/avnmr.fcst.html
SATELLITE IMAGERY
http://www.atmos.washington.edu/cgi-bin/latest.cgi?fronts-ir
http://www.arh.noaa.gov/arhdata/sat/hrpt/latest/s_4j1f.jpg
http://weatheroffice.ec.gc.ca/satellite/index_e.html
http://weatheroffice.ec.gc.ca/data/satellite/hrpt_ykn_ir_100.jpg
WEB CAMS
Alaska web cams index- http://akweathercams.faa.gov/index.php
Skagway Web Cam - http://www.wpyr.com/multimedia/webcam.html
Symbols
UA wx symbols - http://www.ametsoc.org/amsedu/dstreme/extras/wxsym2.html
